


Marketing textbook, chapter 7
Pricing policy → Starting points for determining the optimal offer price → Demand-oriented setting of the offer price → Price-sales function as an important basic model of classical price theory
In a study by Pabsch et al. (2000, p. 109 ff.), the significance of various price components for the choice of electricity tariff of a regional electricity supplier was empirically determined using a choice-based conjoint analysis (CBC) (see also Section 4.4.3.2). Figure 1 provides an overview of the characteristics and characteristic values considered in the study.
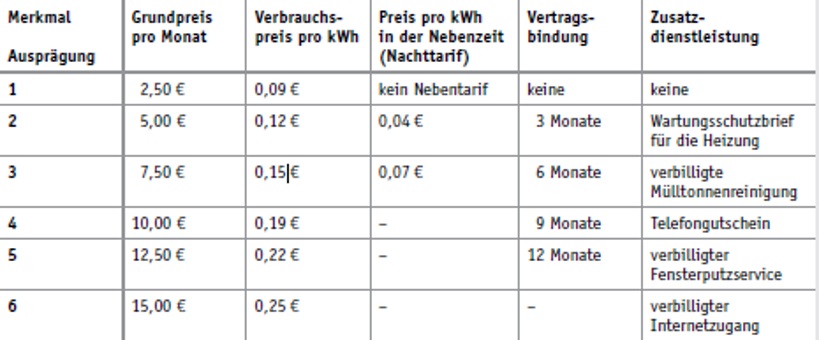
This table shows five different features of electricity tariffs, each with six different characteristics.
The table is divided into columns for the different Features and lines for the Characteristics (1 to 6) subdivided:
In the survey situation, the characteristic values were systematically combined to form holistic product concepts, which were presented to the test subjects for assessment (see Figure 2). The respondents were confronted with several selection situations one after the other and were each asked to state their preferred electricity tariff. However, there was also the option of not choosing a tariff if both alternatives in a selection situation were categorised as unacceptable. This comparison helps users to understand the trade-offs between the tariffs (e.g. lower basic price for tariff 1 vs. lower energy price for tariff 2).
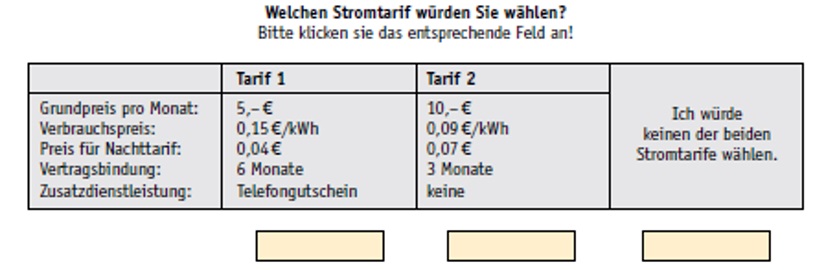
This image represents a classic decision situation (choice set) as presented to test persons during a choice-based conjoint analysis.
Illustration of a selection situation from a questionnaire with two different electricity tariffs and a non-choice option for direct comparison:
Structure and instructions:
The picture shows the question at the top: „Which electricity tariff would you choose? Please tick the appropriate box!“. Below this is a table with three options.
The three selection options in detail:
Interaction: Below each of the three columns there is a light yellow button to click on the preferred option.
In order to carry out a market simulation, it was assumed that electricity customers can choose between three different electricity tariffs. The choice shares for these three tariffs were then calculated using conjoint analysis. Figure 3 illustrates the result of this market simulation.
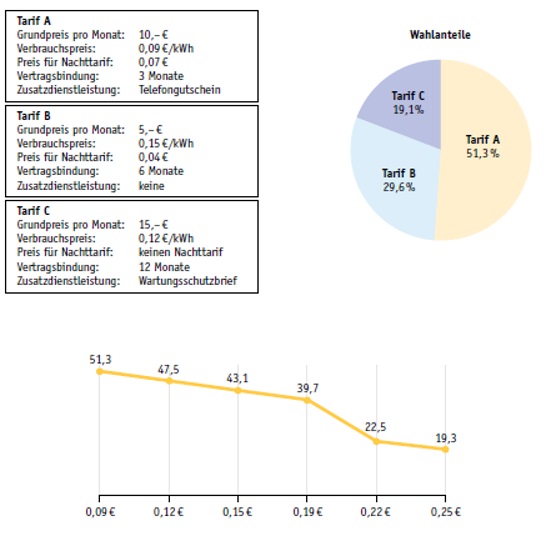
Comparison of three electricity tariffs (A, B, C) with their choice shares as well as a line diagram of the partial preference values of the consumption price:
Upper left half: Definition of tariffs
Three tariff options are listed with their specific features:
Upper right half: Pie chart (voting shares)
The diagram shows the percentage distribution of the decisions:
Lower half: Line diagram
The diagram visualises how the probability of choosing tariff A decreases when the consumption price per kWh increases:
0,25 €: 19,3 %
0,09 €: 51,3 %
0,12 €: 47,5 %
0,15 €: 43,1 %
0,19 €: 39,7 %
0,22 €: 22.5 % (sharp drop)
The most favoured tariff A would be chosen by 51.3 per cent of respondents, while tariffs B (29.6 per cent) and C (19.1 per cent) fared significantly worse. Tariff A has the lowest consumption price at € 0.09 per kWh. It is also possible to calculate the extent to which this tariff loses voting shares if the consumption price is gradually increased. The result is illustrated in the graph at the bottom of Figure 3: If the consumption price for tariff A is increased from €0.09 to €0.12 (tariffs B and C remain unchanged), for example, the proportion of respondents who would choose this tariff falls by 3.8 per cent, from 51.3 to 47.5 per cent.

Additional material for the individual chapters:
3-2: Telecoms advertising - importance of mirror neurons for emotional reactions
3-4: Measuring implicit attitudes using the implicit association test (IAT)
3-6: Subjective perception: Are two tables identical or not?
3-7: The eye eats too: Visual perception influences our feeling of hunger
3-8: Febreze: Importance of habitualised decisions for marketing
4-2: Operationalisation and measurement of the environmental orientation of EU citizens
4-5: Screening questionnaire for the realisation of a predefined sample
4-6: Conception of an interview guide for a qualitative survey
4-7: Observation of individual eating behaviour in the „restaurant of the future“
4-8: Product positioning: Positioning a smartphone brand in the competitive environment
4-9: Testing the preference effect of smoothie properties using choice-based conjoint analysis
7-1: Kindle Fire - Influencing the perception of net benefit through advertising
7-2: Determining the optimal electricity tariff using choice-based conjoint analysis
7-4: Influencing perceived price favourability through umbrella pricing
7-7: High attractiveness of private financing and leasing offers for cars
8-1: Product positioning: Code analysis of the brand presence of two sparkling wine brands
8-12: Advertising impact analysis of digital communication tools
8-3: The power of megatrends and the future of safety and quality
8-5: Guerrilla communication: using a neo-Nazi march for a good cause
8-7: Integrated communication using the example of the Hypoxi brand
You are currently viewing a placeholder content from Instagram. To access the actual content, click the button below. Please note that doing so will share data with third-party providers.
More InformationYou are currently viewing a placeholder content from YouTube. To access the actual content, click the button below. Please note that doing so will share data with third-party providers.
More Information


Study Service Centre
+49 3631 420-222
House 18, Level 1, Room 18.0105