


Marketing textbook, chapter 4
Market research → Data analysis → Multivariate methods of dependency analysis → Conjoint analysis (chapter 4.4.3.2)
The following problems are associated with the use of conjoint analysis in market research practice: Although many features and their characteristics increase the realism of the assessment situation, they quickly lead to a cognitive overload for the respondents. In addition, the assessment task (ranking, rating or pair comparison) does not correspond to the actual decision-making process of consumers at the point of sale.
These disadvantages of the classic conjoint analysis have led to the development of newer approaches, of which the so-called „Choice-Based“ conjoint analysis (CBC) has the greatest empirical relevance. Almost half of all preference measurements conducted in German-speaking countries are carried out using this method (Völckner et al., 2008, p. 689). The special feature of the choice-based conjoint analysis is that the respondents have to make discrete choices, i.e. one alternative is selected from a set of alternatives. However, there is also the realistic possibility of not choosing any of the stimuli presented. The theoretical basis of the „choice-based“ conjoint analysis is the so-called random utility theory (cf. McFadden, 1974, p. 105 ff.). The procedure can be illustrated using the following example:
An online concept test was used to analyse the preference effect of various properties of smoothies. Smoothies are whole-fruit drinks that form a sub-market of fruit juices. The following questions were to be answered: What influence do various features of smoothies have on consumers„ purchasing decisions? Which characteristics of the features are particularly favoured by the target group? 300 people were surveyed who stated that they had already bought smoothies. The features to be analysed and their characteristics are shown in Figure 1.
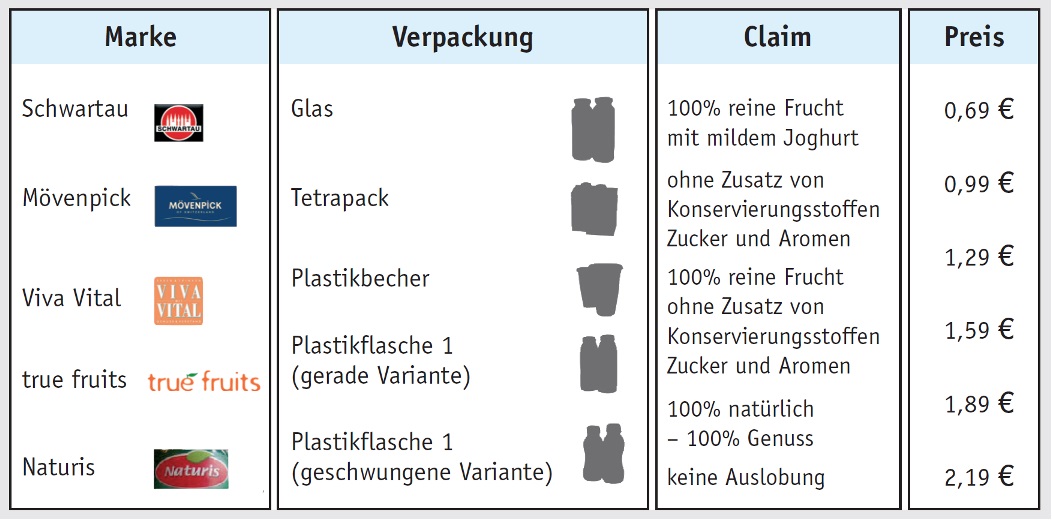
The study is based on the following four groups of characteristics:
With the help of a suitable introductory scenario, the respondents were placed in a realistic decision-making situation and then confronted with 12 shopping situations, each with three smoothie products. Each stimulus consisted of a systematic combination of the four characteristics to be tested. The respondents„ only judgement task was to indicate which of the three products shown they would choose. The option “I would not buy any of the products shown" could be ticked if none of the alternatives shown were deemed acceptable. Figure 2 shows an example of one of the selection situations.
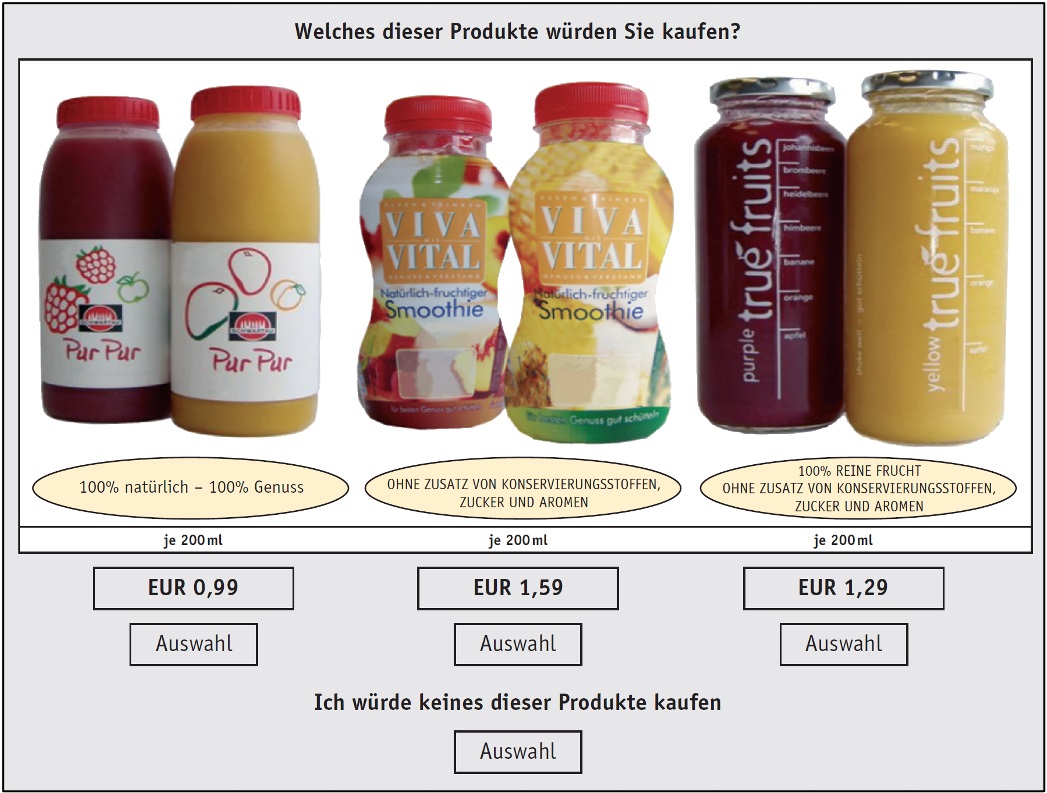
Example of a selection situation (choice set) with three smoothie offers from the Schwartau, Viva Vital and true fruits brands and a ‚None‘ option.
Above the selection is the question: „Which of these products would you buy?“. There are three variants to choose from, each containing 200 ml:
The relative importance of the features for the respondents„ choice decisions is shown on the left-hand side of Figure 3. The “price„ has the greatest significance with a relative importance of more than 50 per cent, while the product claim, i.e. the verbal “claim", tends to play a subordinate role in the decision.
The partial preference values of the characteristic attributes provide information on which attribute of a characteristic is particularly favoured by the respondents. The right-hand side of Figure 3 shows the partial preference values for the characteristic „packaging“ as an example. The respondents clearly prefer the plastic bottle in the curved version, while the tetra pack has the lowest preference effect.
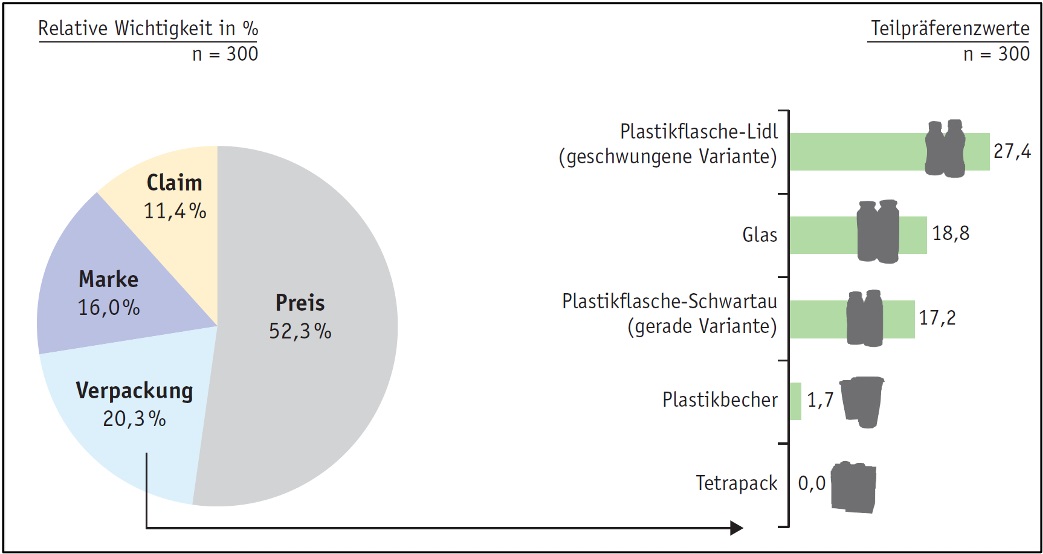
Left graph: Relative importance of the characteristics (pie chart) The diagram shows how strongly the individual features influence the purchase decision:
Right graph: Partial preference values (dimensionless) for the characteristic „Packaging“ (bar chart) The bars show the preference value of the different forms of packaging, whereby the characteristic with the lowest preference is set to zero:
The relative importance of the features for the respondents„ choice decisions is shown on the left-hand side of Figure 3. The “price„ has the greatest significance with a relative importance of more than 50 per cent, while the product claim, i.e. the verbal “claim", tends to play a subordinate role in the decision.
The partial preference values of the characteristic attributes provide information on which attribute of a characteristic is particularly favoured by the respondents. The right-hand side of Figure 3 shows the partial preference values for the characteristic „packaging“ as an example. The respondents clearly prefer the plastic bottle in the curved version, while the tetra pack has the lowest preference effect.

Additional material for the individual chapters:
3-2: Telecoms advertising - importance of mirror neurons for emotional reactions
3-4: Measuring implicit attitudes using the implicit association test (IAT)
3-6: Subjective perception: Are two tables identical or not?
3-7: The eye eats too: Visual perception influences our feeling of hunger
3-8: Febreze: Importance of habitualised decisions for marketing
4-2: Operationalisation and measurement of the environmental orientation of EU citizens
4-5: Screening questionnaire for the realisation of a predefined sample
4-6: Conception of an interview guide for a qualitative survey
4-7: Observation of individual eating behaviour in the „restaurant of the future“
4-8: Product positioning: Positioning a smartphone brand in the competitive environment
4-9: Testing the preference effect of smoothie properties using choice-based conjoint analysis
7-1: Kindle Fire - Influencing the perception of net benefit through advertising
7-2: Determining the optimal electricity tariff using choice-based conjoint analysis
7-4: Influencing perceived price favourability through umbrella pricing
7-7: High attractiveness of private financing and leasing offers for cars
8-1: Product positioning: Code analysis of the brand presence of two sparkling wine brands
8-12: Advertising impact analysis of digital communication tools
8-3: The power of megatrends and the future of safety and quality
8-5: Guerrilla communication: using a neo-Nazi march for a good cause
8-7: Integrated communication using the example of the Hypoxi brand
You are currently viewing a placeholder content from Instagram. To access the actual content, click the button below. Please note that doing so will share data with third-party providers.
More InformationYou are currently viewing a placeholder content from YouTube. To access the actual content, click the button below. Please note that doing so will share data with third-party providers.
More Information


Study Service Centre
+49 3631 420-222
House 18, Level 1, Room 18.0105