


Marketing textbook, chapter 9
Distribution policy → Acquisition-based distribution → Management of distribution channels → Organisation of distribution relationships (section 9.2.4.3)
In modern retail companies, space utilisation and product arrangement on the shelves are not left to chance. Retail marketing specialists have long been concerned with optimising the presentation of goods at the point of sale under the heading of „space management“.
The relevance of this becomes clear when you realise that around one in two people in the food trade go shopping without a shopping list and that customers only make many purchasing decisions at the point of sale (Franzen/Schäfer, 2009). The US retail giant Wal-Mart, for example, is known to operate its own research centre in which, among other things, the arrangement of goods in the shop and on the shelves is optimised. The aim is to increase the attractiveness of sales and shelf space, thereby making it easier for customers to find their way around and increasing their search satisfaction, triggering group and spontaneous purchases, reducing handling, capital commitment and space costs for retailers and taking appropriate account of the value of the various sales zones. Space management measures must be distinguished from the design of the shop atmosphere (shopfitting). Space management relates to the arrangement of the sales areas in the shop and the goods on the shelves, whereas shopfitting relates to design aspects (choice of materials, shelf design, lighting, use of colour, floor coverings, etc.).
Initial decisions relate to the utilisation of the available sales space. The space is divided into so-called functional zones, which essentially include the product group areas or departments as well as quiet zones, promotional areas and the checkout zone. When arranging product groups, the customer's search logic must be taken into account (e.g. baby food is not expected in the tinned food section, but rather in the other baby products according to need), which in turn has a positive effect on orientation and therefore also on shopping satisfaction.
The left-hand twist of the customer is also often taken into account by creating an anti-clockwise customer flow along the wall. On the other hand, the needs of retailers are of course also taken into account. In wide aisles and in the entrance area, promotional merchandise is often displayed or the path is blocked with merchandise tables to reduce the walking speed of customers. This ensures that the front product groups with irregular goods also attract attention. Goods for daily needs (e.g. bread, dairy products, sausage and meat) are usually located at the back of the shop so that customers have to pass through the other product groups in front, thereby increasing the likelihood of impulse purchases. Care should be taken to ensure that the customer does not perceive the distances in the shop as a loss of time, as this could lead to annoyance. To encourage combined purchases, goods that are consumed together can also be placed across different product ranges. An example of this would be a stand with wine right next to the cheese counter. For confectionery manufacturers, the checkout zone is particularly popular, where many impulse purchases are made while waiting. However, retailers also place goods here that either need to be supervised (e.g. cigarettes, spirits) or that are easily forgotten when shopping (e.g. batteries).
Other decisions relate to the placement of items on the shelf. The acquisition effect of the product arrangement depends in particular on the habitual buying behaviour of the customer, the attractiveness of the various product groups, the value of the shelf space and the number of front pieces of an article in the first row of shelves. The aim is to create shelf displays that promote sales. Optimisation tests have shown, for example, that impulse items should be placed at eye and handle height and magnetic items (well-known, high-demand products) should be placed in the peripheral zones to attract attention. The centre of the shelf receives the most attention, whereby a slight rightward orientation of the gaze must be taken into account. Weak areas can be found in the bend and stretch zones (see illustration). The arrangement of a product group (e.g. toothpaste) within a product range (e.g. body care) is usually vertical, i.e. different brands of toothpaste are arranged on the shelf from top to bottom, with toothbrushes, mouthwash and the like also arranged vertically. A horizontal arrangement (one shelf with toothpaste, toothbrushes below, mouthwash below, etc.) is not recommended, as this makes comparison difficult and does not take sufficient account of the value of the shelf zones. The number of front pieces (facing) is a matter of placement width and stacking height. Manufacturers aim to maximise the number of fronts on their products in order to increase contact performance. However, American studies have shown a rather weak correlation between placement width and sales. For example, 40 per cent of shelves with facings that are too wide are misplaced. In addition to the contact area, other factors such as pack design and size as functions of product design (see section 6.3.2.4) and the product type also play a role. For example, basic goods are purchased selectively, which leads to a low correlation between facing and sales, while this correlation increases for irregular goods. A vertical product arrangement is recommended, in which the product group is arranged vertically and the different brands of the product group are distributed across the shelf heights (e.g. brand A at the top, with the other brands below). In order not to jeopardise the sales-promoting properties of optimised shelves, shelf gaps must be avoided through continuous replenishment. Otherwise, customers may quickly get the impression that the shop offers too little choice.
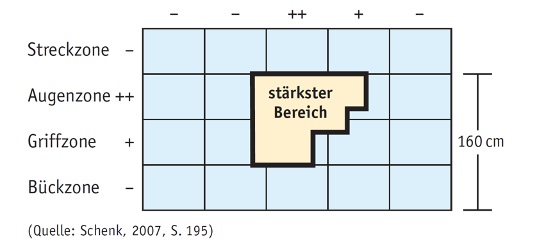
Schematic representation of the shelf zones (bend, reach, eye and stretch zones) with labelling of the area with the highest turnover at eye and reach height.
The illustration shows a grid that rates a shop shelf vertically and horizontally. The vertical zones are labelled and evaluated as follows:
Further details of the graphic:
Dimensions: A vertical line on the right-hand side marks a standard height of 160 cm for the eye and grip zone.
Strongest area: A central block, highlighted in yellow, marks the „strongest area“. It extends horizontally across the centre and vertically across the eye and grip zone.
Horizontal valuation: The horizontal plane is also rated at the upper edge. The centre is marked with ++ characterised, while the edge areas with - fall off.
To monitor the success of product placement, productivity figures (ratio of net profit to the number of square metres used), sales and contribution margins with regard to sales and shelf space, turnover rates and the popularity of articles („top sellers and bums“), handling costs and the probability and intensity of composite purchases are calculated.

Additional material for the individual chapters:
3-2: Telecoms advertising - importance of mirror neurons for emotional reactions
3-4: Measuring implicit attitudes using the implicit association test (IAT)
3-6: Subjective perception: Are two tables identical or not?
3-7: The eye eats too: Visual perception influences our feeling of hunger
3-8: Febreze: Importance of habitualised decisions for marketing
4-2: Operationalisation and measurement of the environmental orientation of EU citizens
4-5: Screening questionnaire for the realisation of a predefined sample
4-6: Conception of an interview guide for a qualitative survey
4-7: Observation of individual eating behaviour in the „restaurant of the future“
4-8: Product positioning: Positioning a smartphone brand in the competitive environment
4-9: Testing the preference effect of smoothie properties using choice-based conjoint analysis
7-1: Kindle Fire - Influencing the perception of net benefit through advertising
7-2: Determining the optimal electricity tariff using choice-based conjoint analysis
7-4: Influencing perceived price favourability through umbrella pricing
7-7: High attractiveness of private financing and leasing offers for cars
8-1: Product positioning: Code analysis of the brand presence of two sparkling wine brands
8-12: Advertising impact analysis of digital communication tools
8-3: The power of megatrends and the future of safety and quality
8-5: Guerrilla communication: using a neo-Nazi march for a good cause
8-7: Integrated communication using the example of the Hypoxi brand
You are currently viewing a placeholder content from Instagram. To access the actual content, click the button below. Please note that doing so will share data with third-party providers.
More InformationYou are currently viewing a placeholder content from YouTube. To access the actual content, click the button below. Please note that doing so will share data with third-party providers.
More Information


Study Service Centre
+49 3631 420-222
House 18, Level 1, Room 18.0105